Demo- Holographic Portfolio
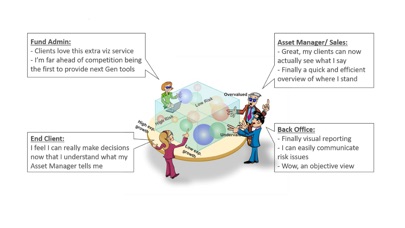
Visual-Qi is a 3D visualization tool that supports you and your clients to make the right decisions fast and stay ahead of the curve. Visual-Qi allows the user to immediately understand the key information by providing a simple view of abstract and complex data.
Go beyond the capabilities provided by your spread sheet and 2D graphs. Easily interprete and communicate complex data.
Available as an extension for SynoFin Riskman, Visual Qi is a product created by ARdictive s.a.s., a Paris based company. We would like to express a special thanks to Loïs Monet for his work. We focus on using augmented reality technology in the service of understanding and transmission for a maximum impact.
If you dont have the marker, please download it on this page: http://holo-fund.visual-qi.com or you can view the non augmented version of the graph by selecting the 3D mode.

